
Watch the companion video for this post: (Why) is LaTeX slow? Profiling a custom C++ TeX engine
There is a distinct milestone in the life of any custom TeX engine when it moves from an interesting toy to a functioning typesetting platform: the day it can successfully compile a modern LaTeX document. TeX82 is built around a few hundred “primitives” (control sequences that instruct the engine to do specific operations); compiling LaTeX requires those primitives, and the e-TeX extensions (another ~65 primitives), and another twenty-something utility primitives needed by the latex 3 kernel.
On top of that, there was also a little bit of pragmatic trickery involved in convincing the LaTeX format preloader that NemaTeX was actually XeTeX (so that it would execute its startup routines without aborting) while also completely redefining what “XeTeX” meant in different parts of the LaTeX base ecosystem.
Seeing an article class document compile cleanly for the first time was an unreasonably satisfying moment. But almost immediately, it brought back a question that has puzzled many LaTeX users: why does LaTeX feel so slow compared to plain TeX? If you run plain TeX on a 100-page document, compilation is practically instantaneous – less than a hundred milliseconds! But compiling even a modest LaTeX document with a few standard packages can lead to a several-second wait. As part of my exploration, I instrumented the code for both traditional profiling and to look more specifically at how the macro expansion part of TeX works.
Instrumenting the Macro Expander
To find the true bottleneck, we instrumented NemaTeX’s macro expansion engine (macroExpander.cpp). Using a lightweight RAII profiling scope, the engine records token expansion counts, call-tree nesting depths, and elapsed wall-clock times. Schematically, something like
struct MacroProfileScope {
    std::string_view macroName;
    std::chrono::high_resolution_clock::time_point startTime;

    explicit MacroProfileScope(std::string_view name)
        : macroName(name), startTime(std::chrono::high_resolution_clock::now()) {}

    ~MacroProfileScope() {
        auto elapsed = std::chrono::high_resolution_clock::now() - startTime;
        MacroProfiler::record_expansion(macroName, elapsed);
    }
};
I set things up to also keep track of primitives, core algorithmic loops in the engine (like line breaking or text shaping), the cost of processing macro arguments, etc. I then exported the information so that I could look at flame graphs or a callgrind-style output. I don’t know… I just think these kind of views into the macro expansion part of TeX are extremely cool.
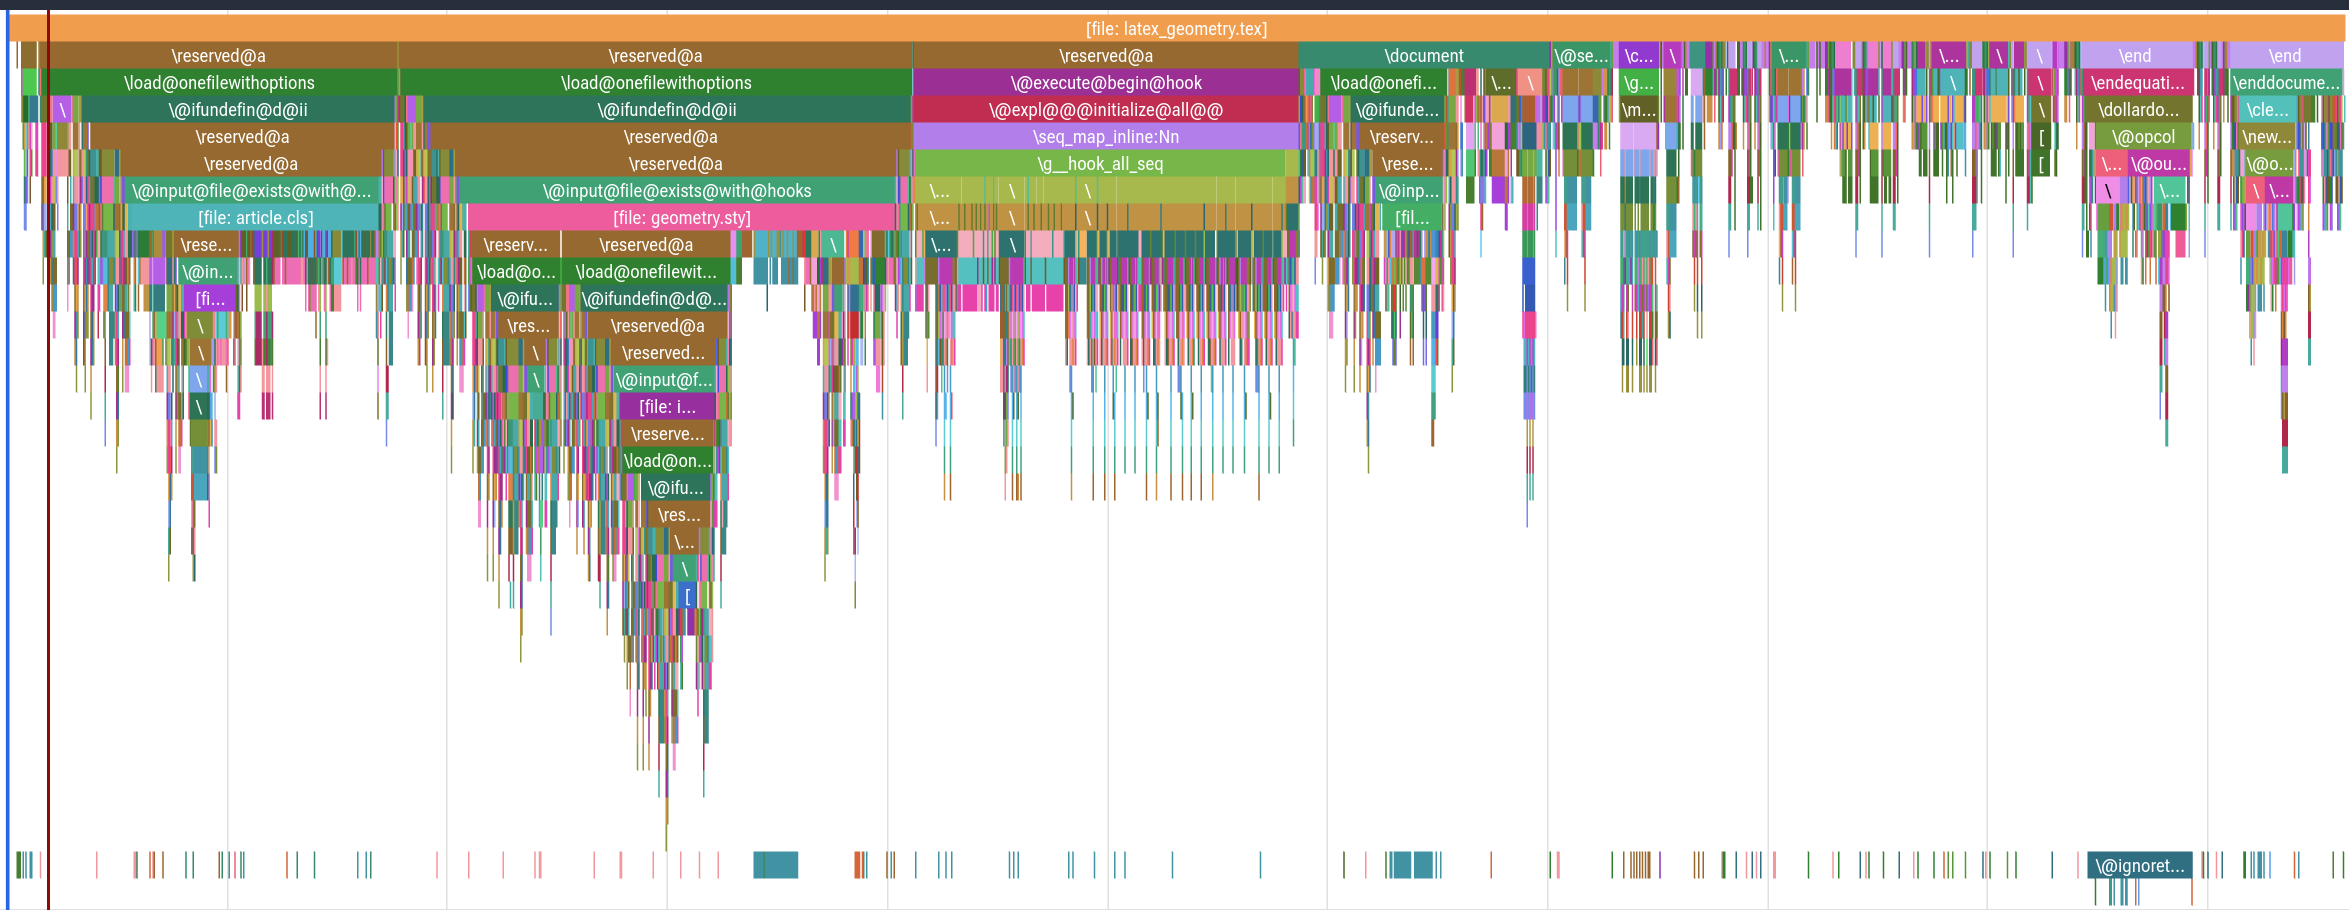
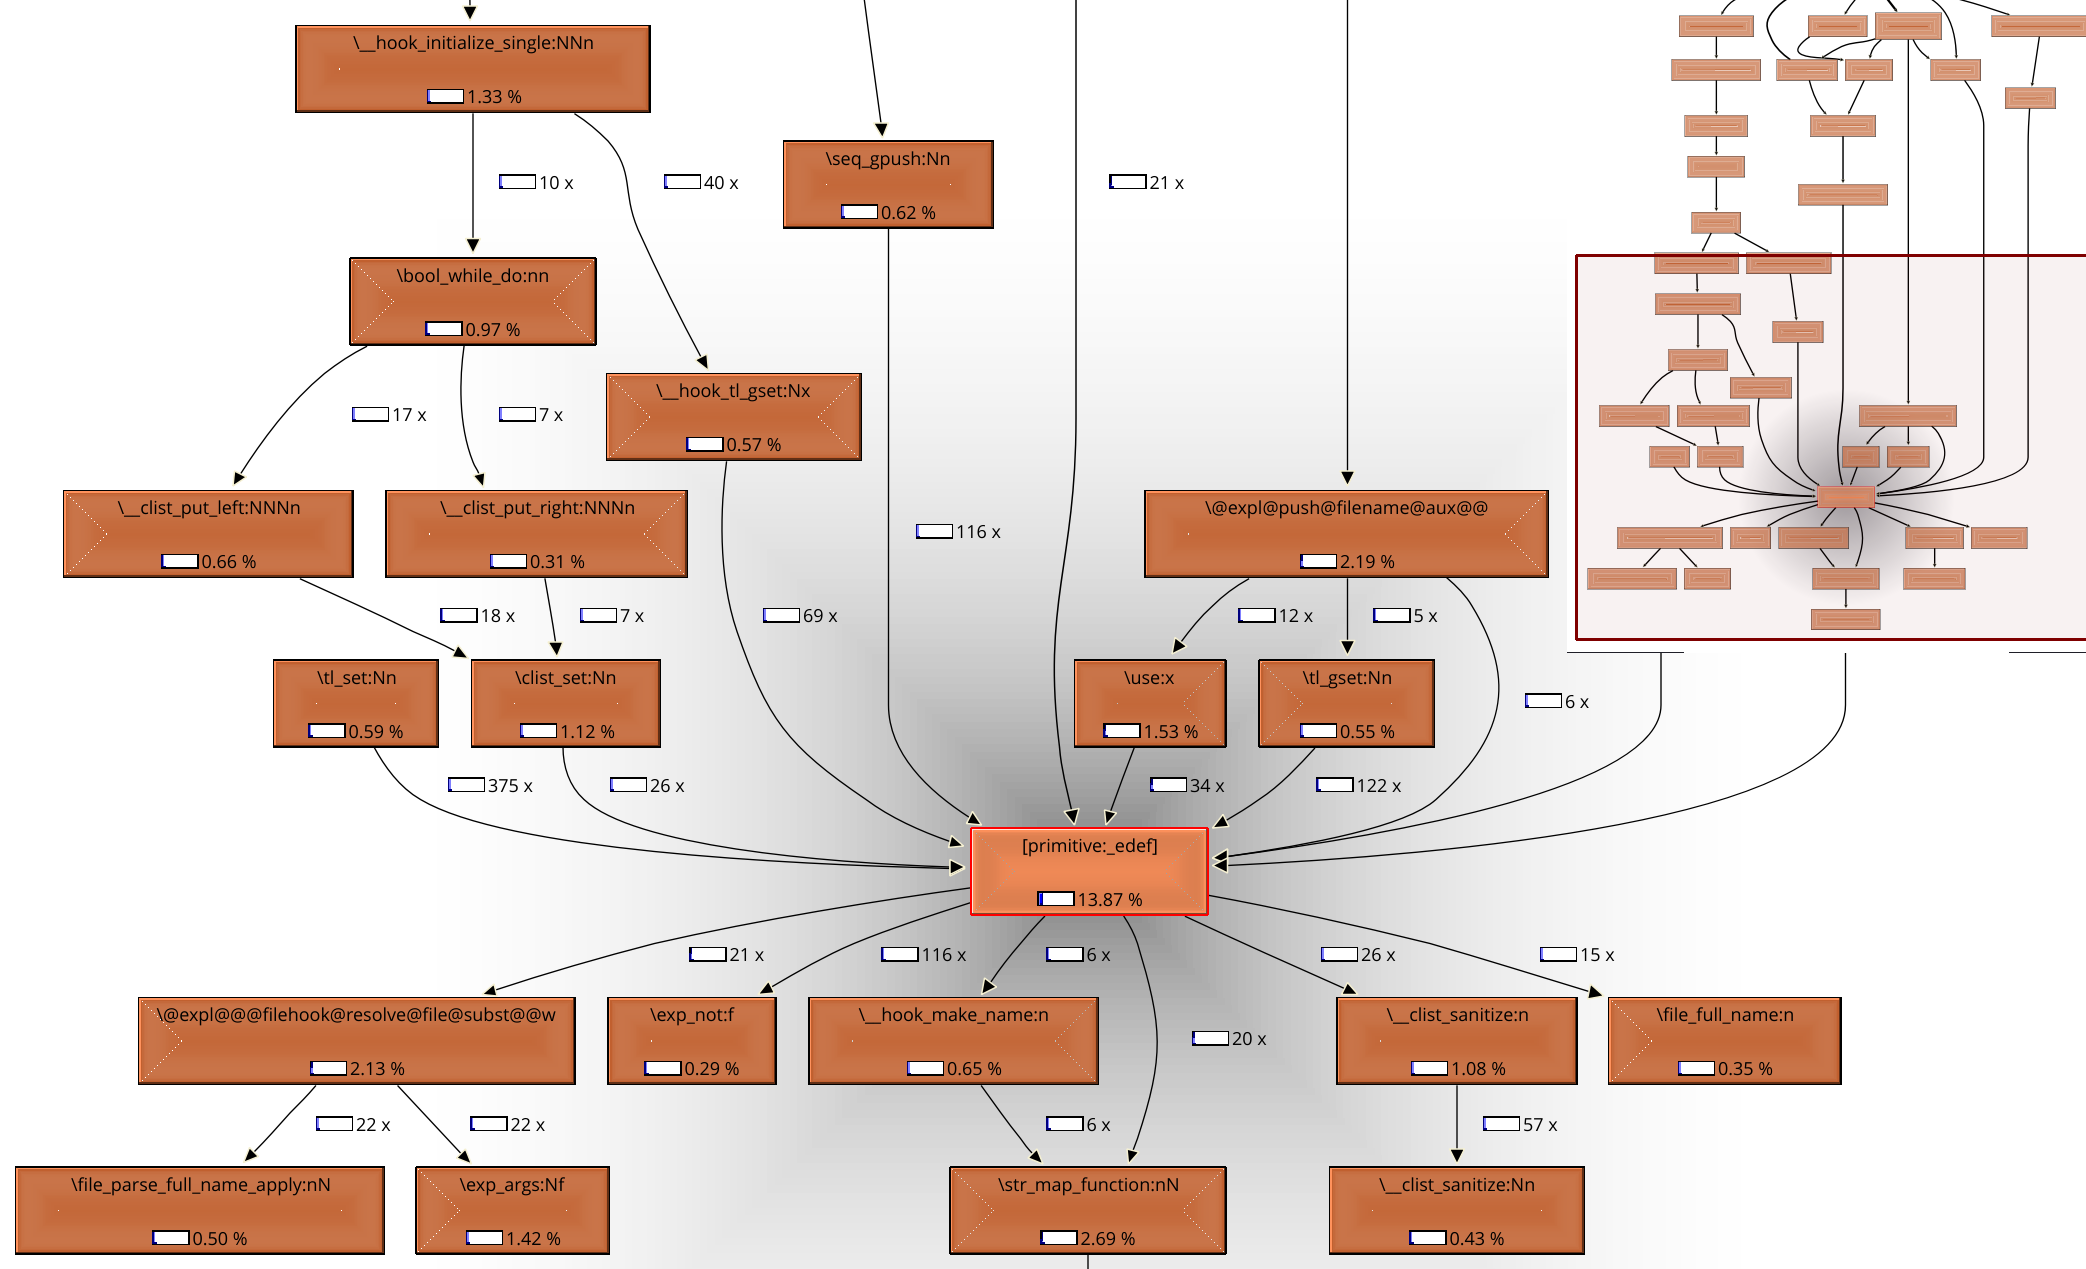
The flame graph helps make the scope of things clear: what might be a 2-page document with ~50 obvious macros (like \begin{equation} and $\mathcal{O}$) might actually be churning through 50000 macro calls in the LaTeX ecosystem!
Premature Optimization vs. Premature Pessimization
Seeing these flame graphs clarifies what matters when optimizing an engine. Spending hours hand-tuning the SIMD vectorization of font metrics or micro-optimizing the Knuth-Plass hyphenation loop yields negligible gains if the engine spends 85% of its time pushing and popping tokens in macro expansion. If we want LaTeX documents to compile in milliseconds, this helps make the real targets clear. We should be optimizing token dispatch, format-file preloading, and so on. In the next post, we’ll look at what happens when you apply those targeted optimizations.
Knuth taught us that “premature optimization is the root of all evil” (although what exactly that means and where it came from is quite interesting!), so held off on what I assumed were a lot of relative easy performance wins. I simply had no idea if they were going to be meaningful for representative LaTeX workloads. On the other hand, thinking about performance often means setting up the architecture so that optimization is possible – don’t “prematurely pessimize”!